Graphics
Bring your buildingto life.
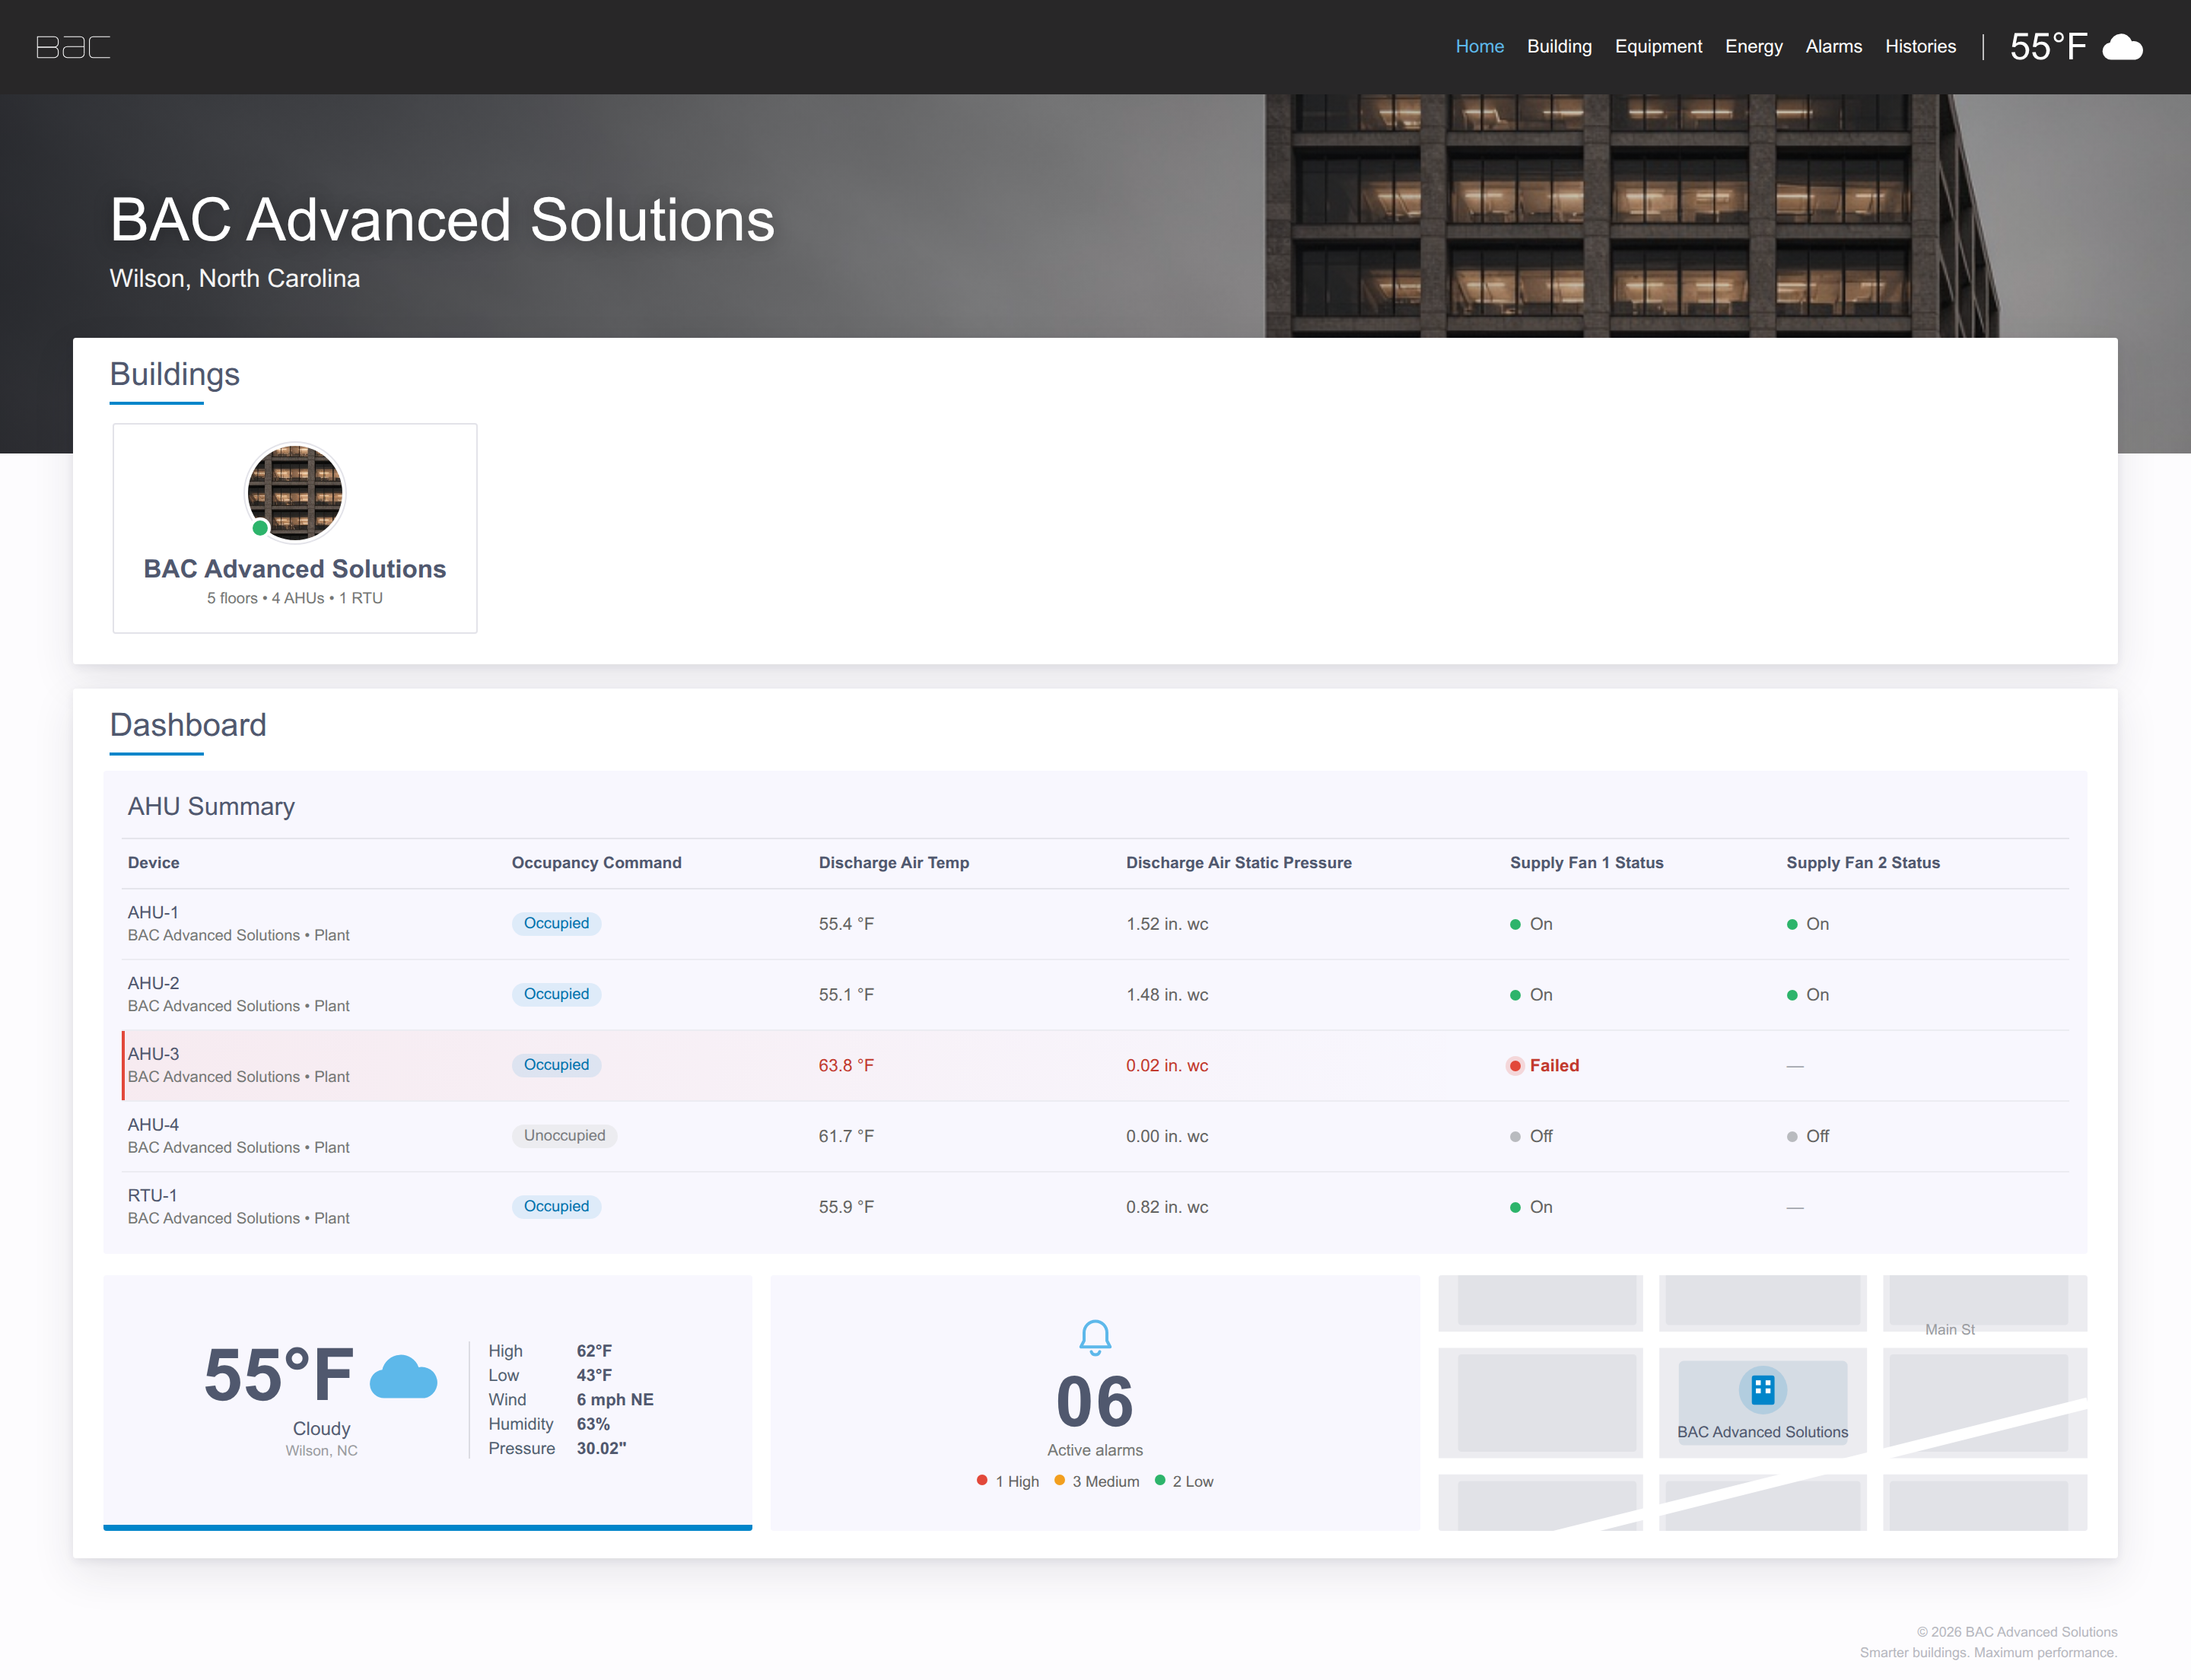
We design custom Niagara graphics as live, responsive dashboards built around your equipment, your floors, and the way your team works.

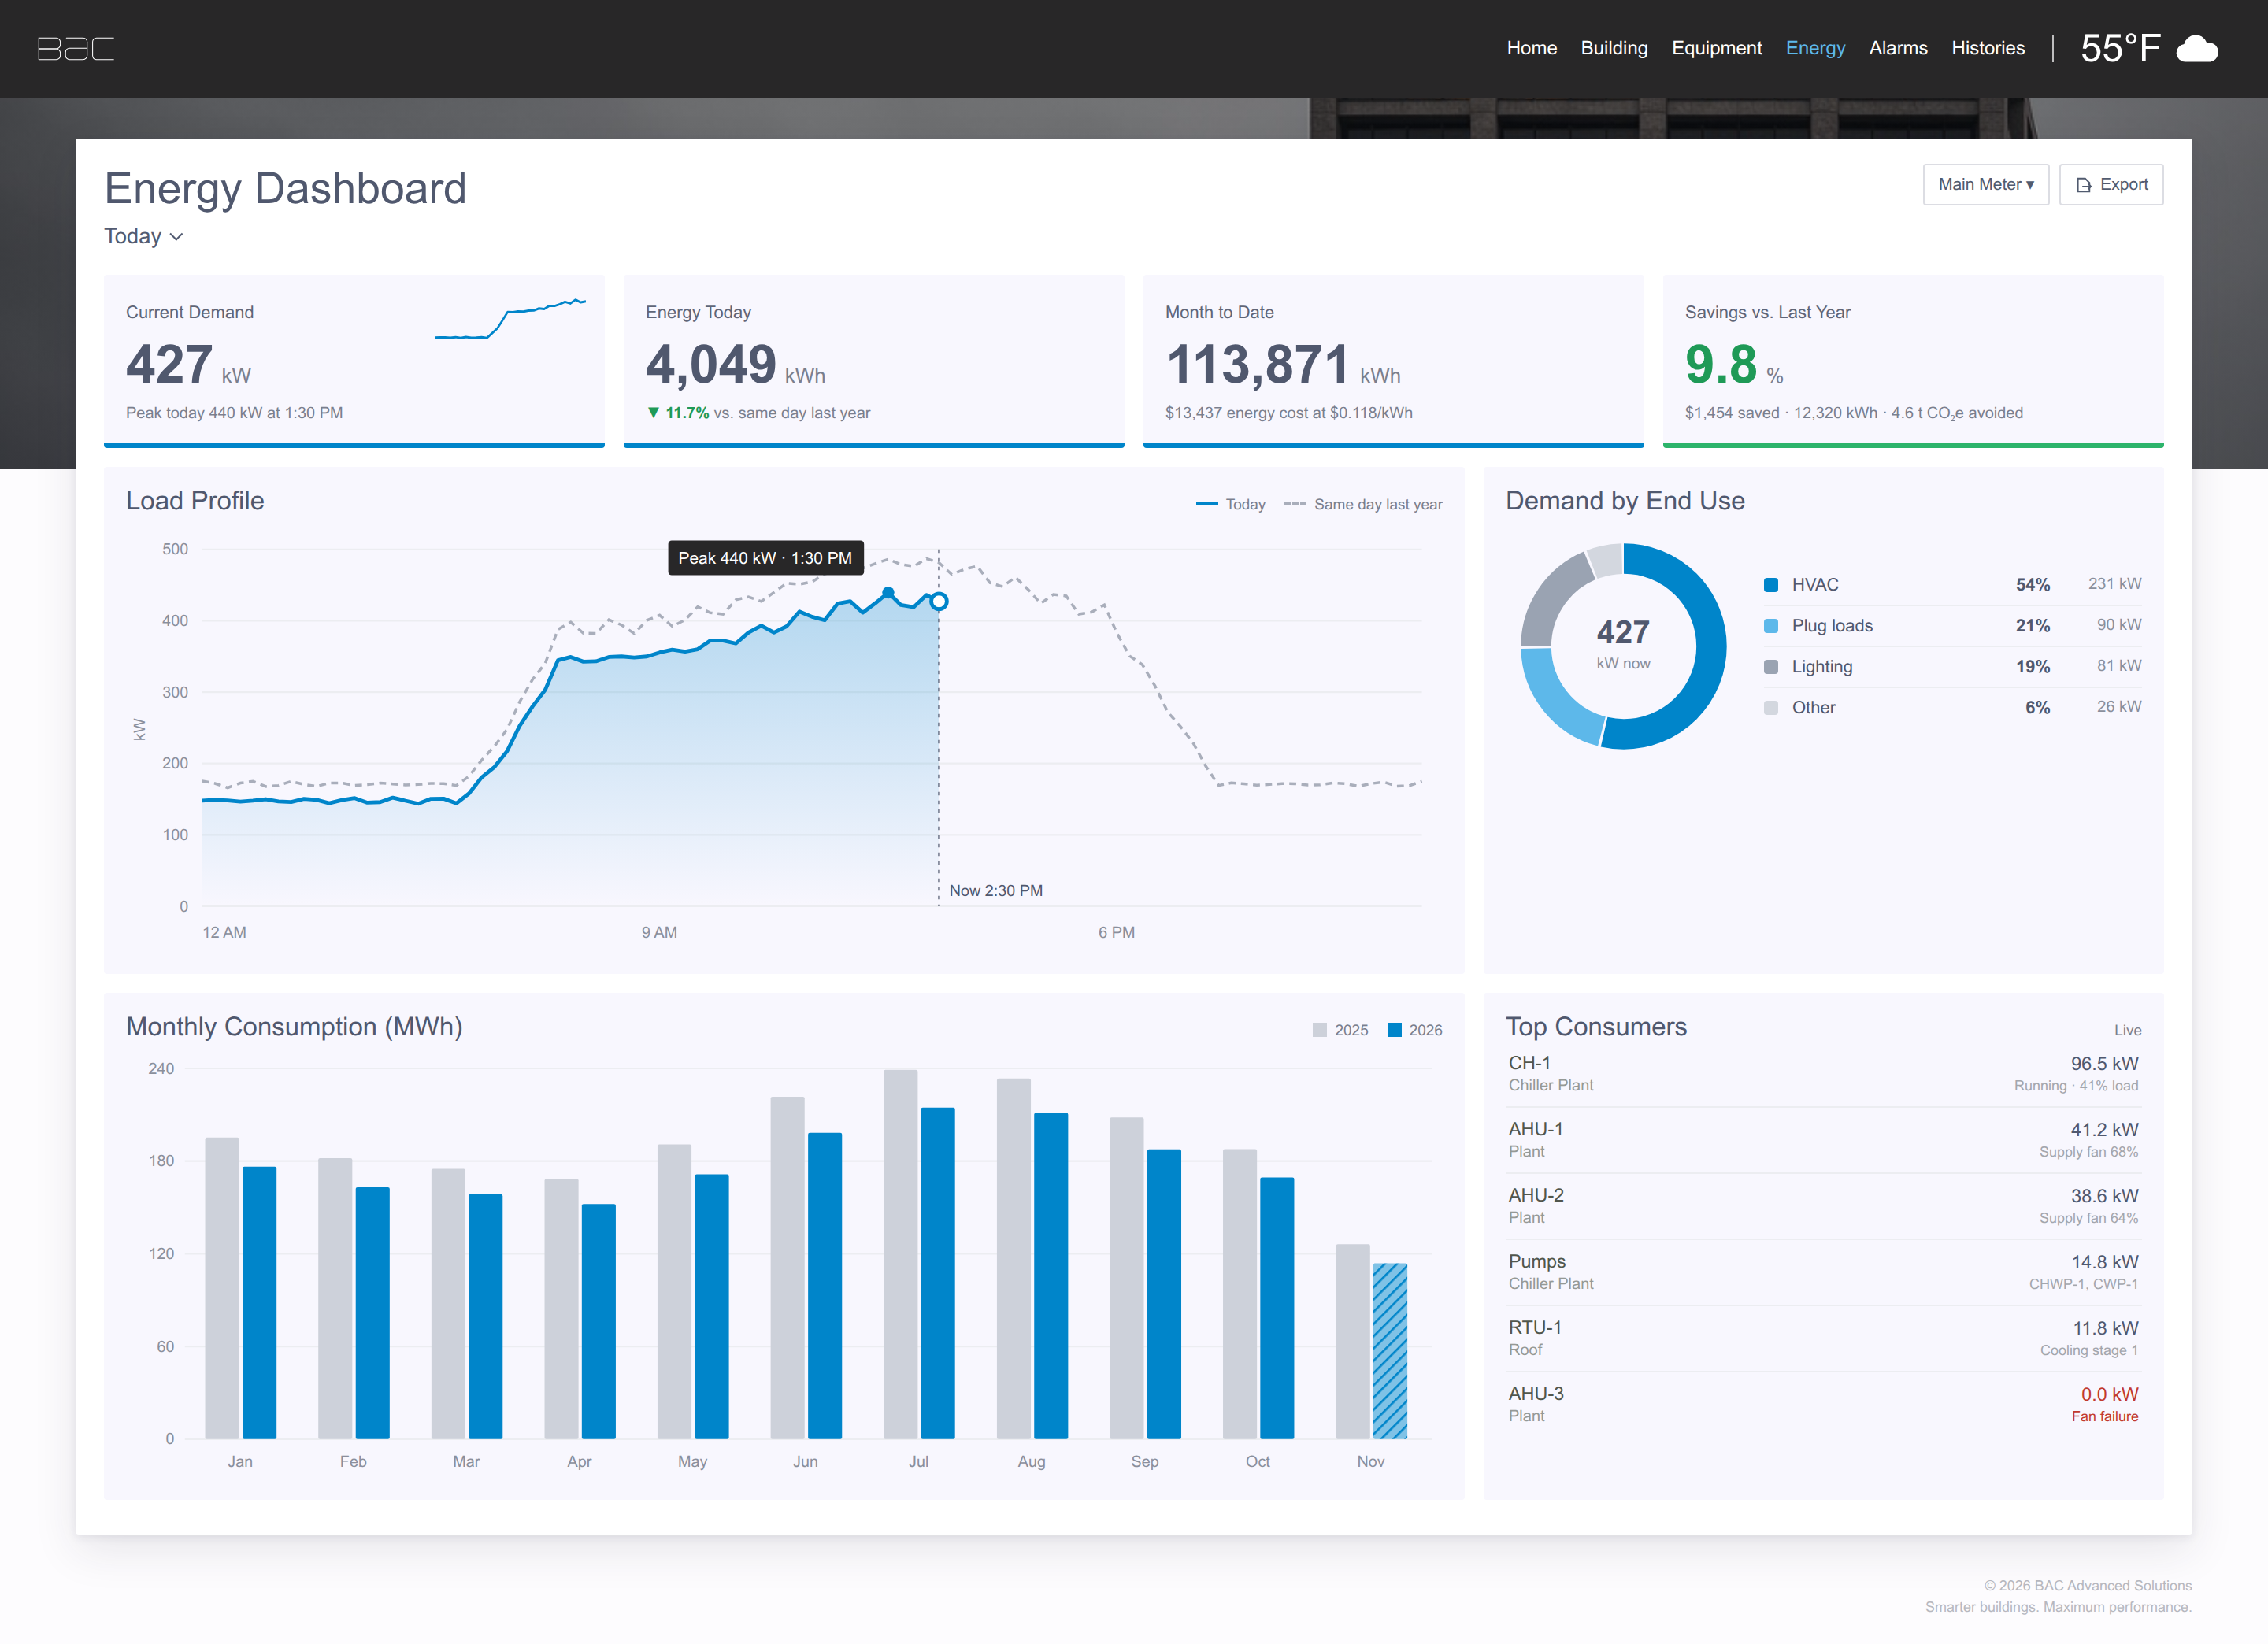
We design custom Niagara graphics as live, responsive dashboards built around your equipment, your floors, and the way your team works.
Live readings from every zone, right on the 3D floor plan. Hot spaces glow red, cold spaces glow blue, so the problem rooms stand out before anyone calls.
Energy dashboards with live kW demand, today’s load profile against last year, month-to-date use and cost, and savings. Equipment health dashboards that show alarms, faults, overrides, and offline devices at a glance. Comfort dashboards that map zone temperatures, setpoints, and airflow across every floor. Plant dashboards for chillers, boilers, and pumps with run status, supply and return temperatures, and staging. All of it on clean screens built for everyone who keeps the building running.
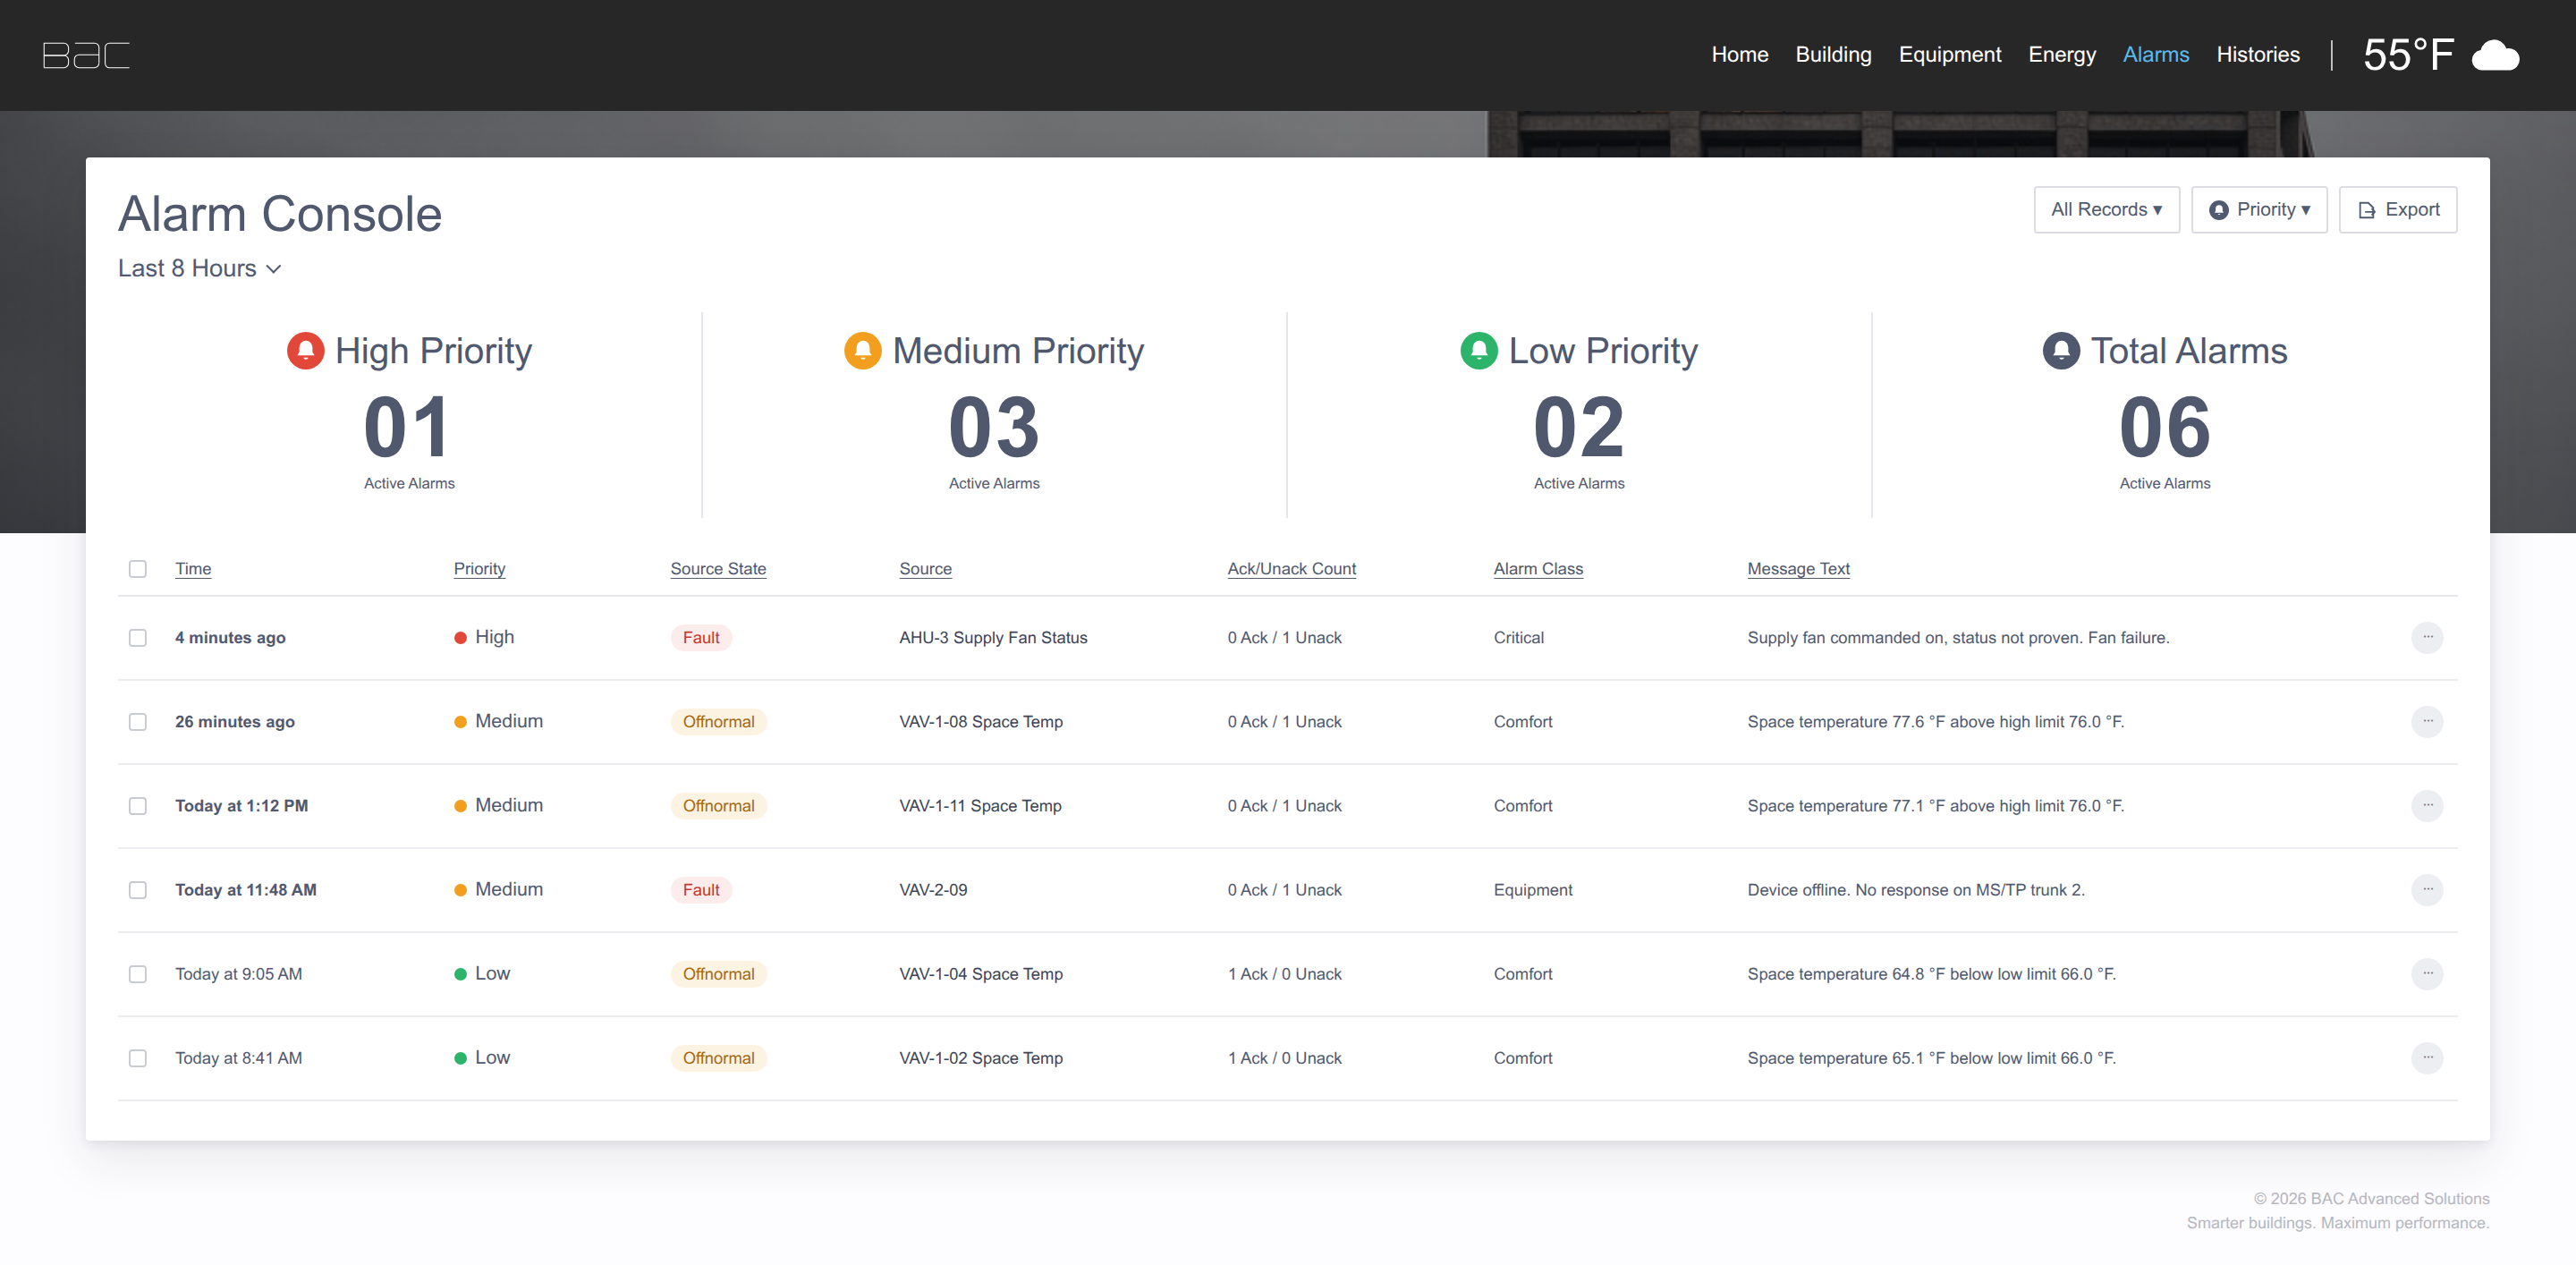
Every active alarm ranked by priority, with source, state, and acknowledgement in one view, so your team works the right problem first.
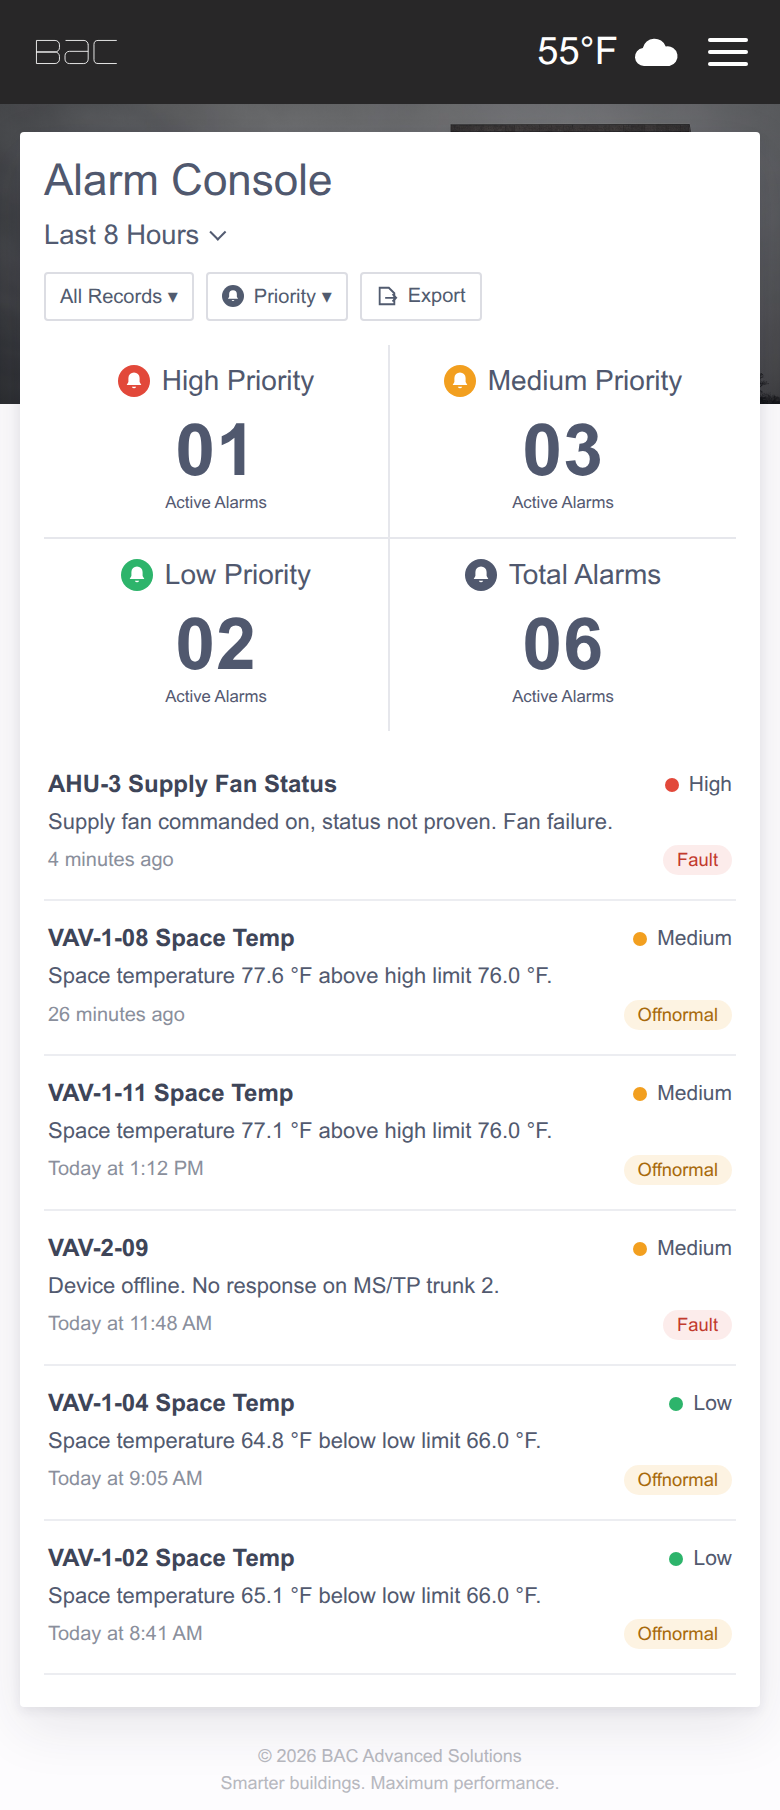
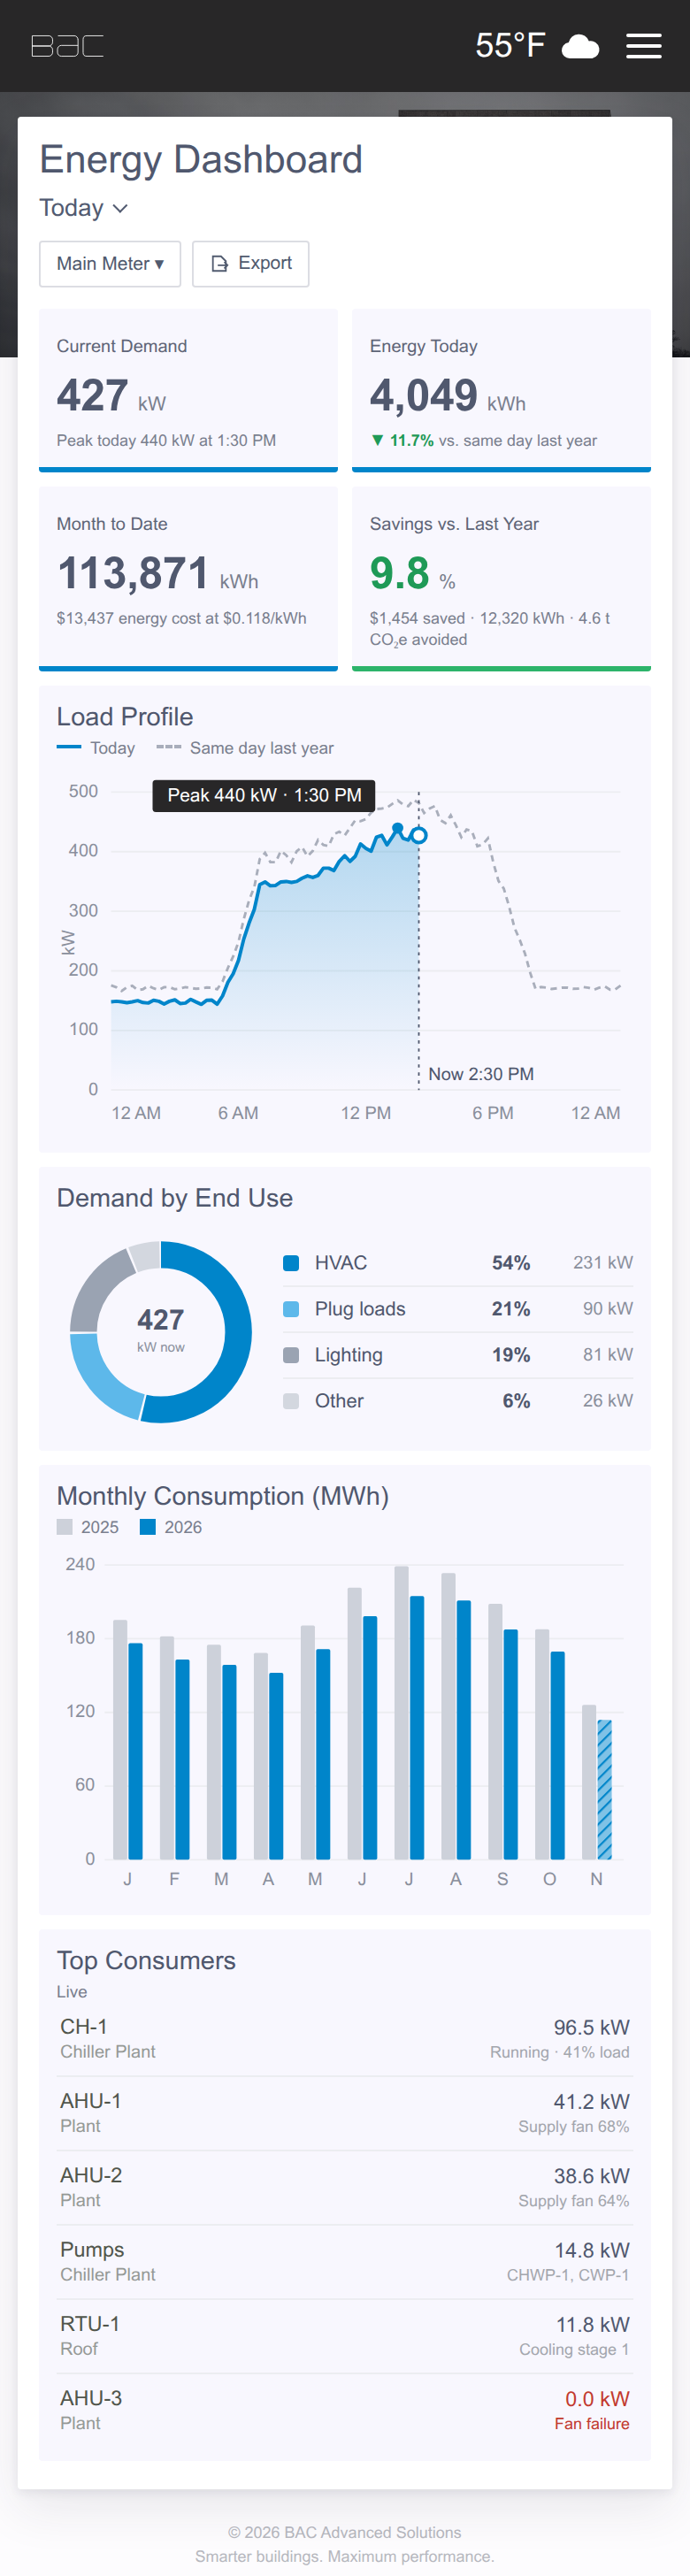
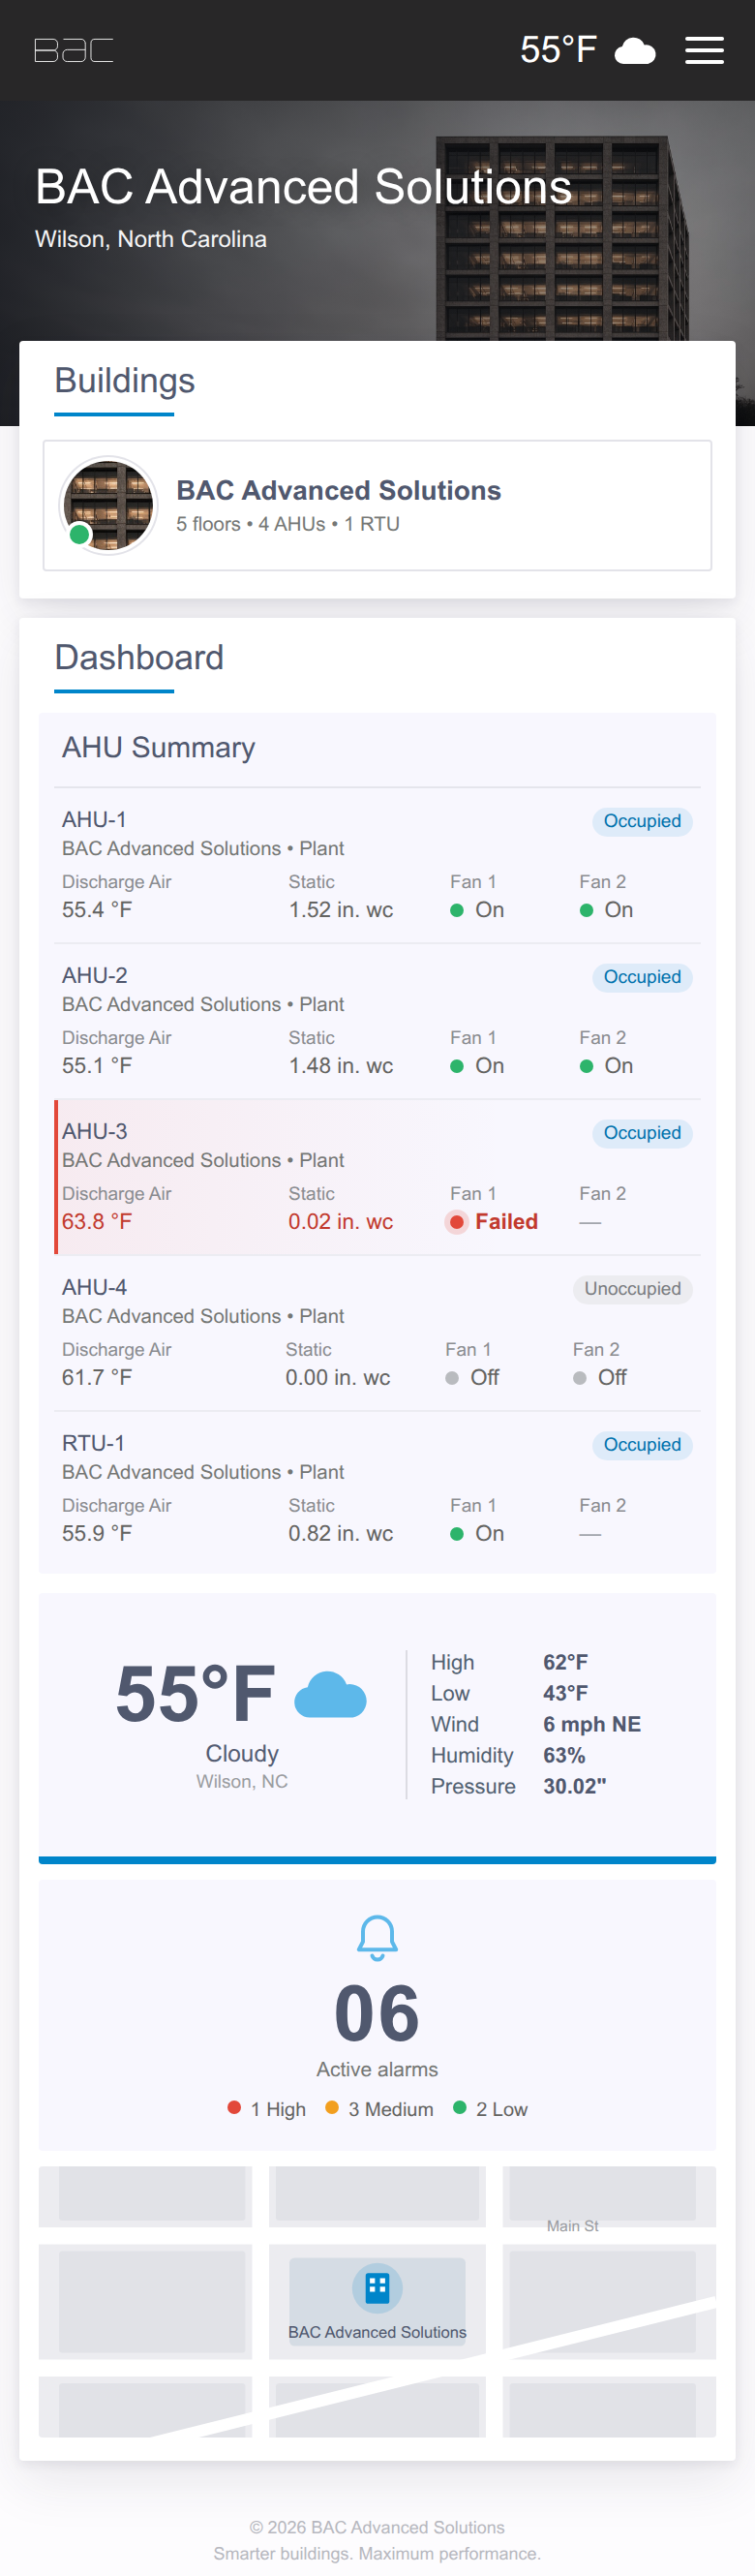
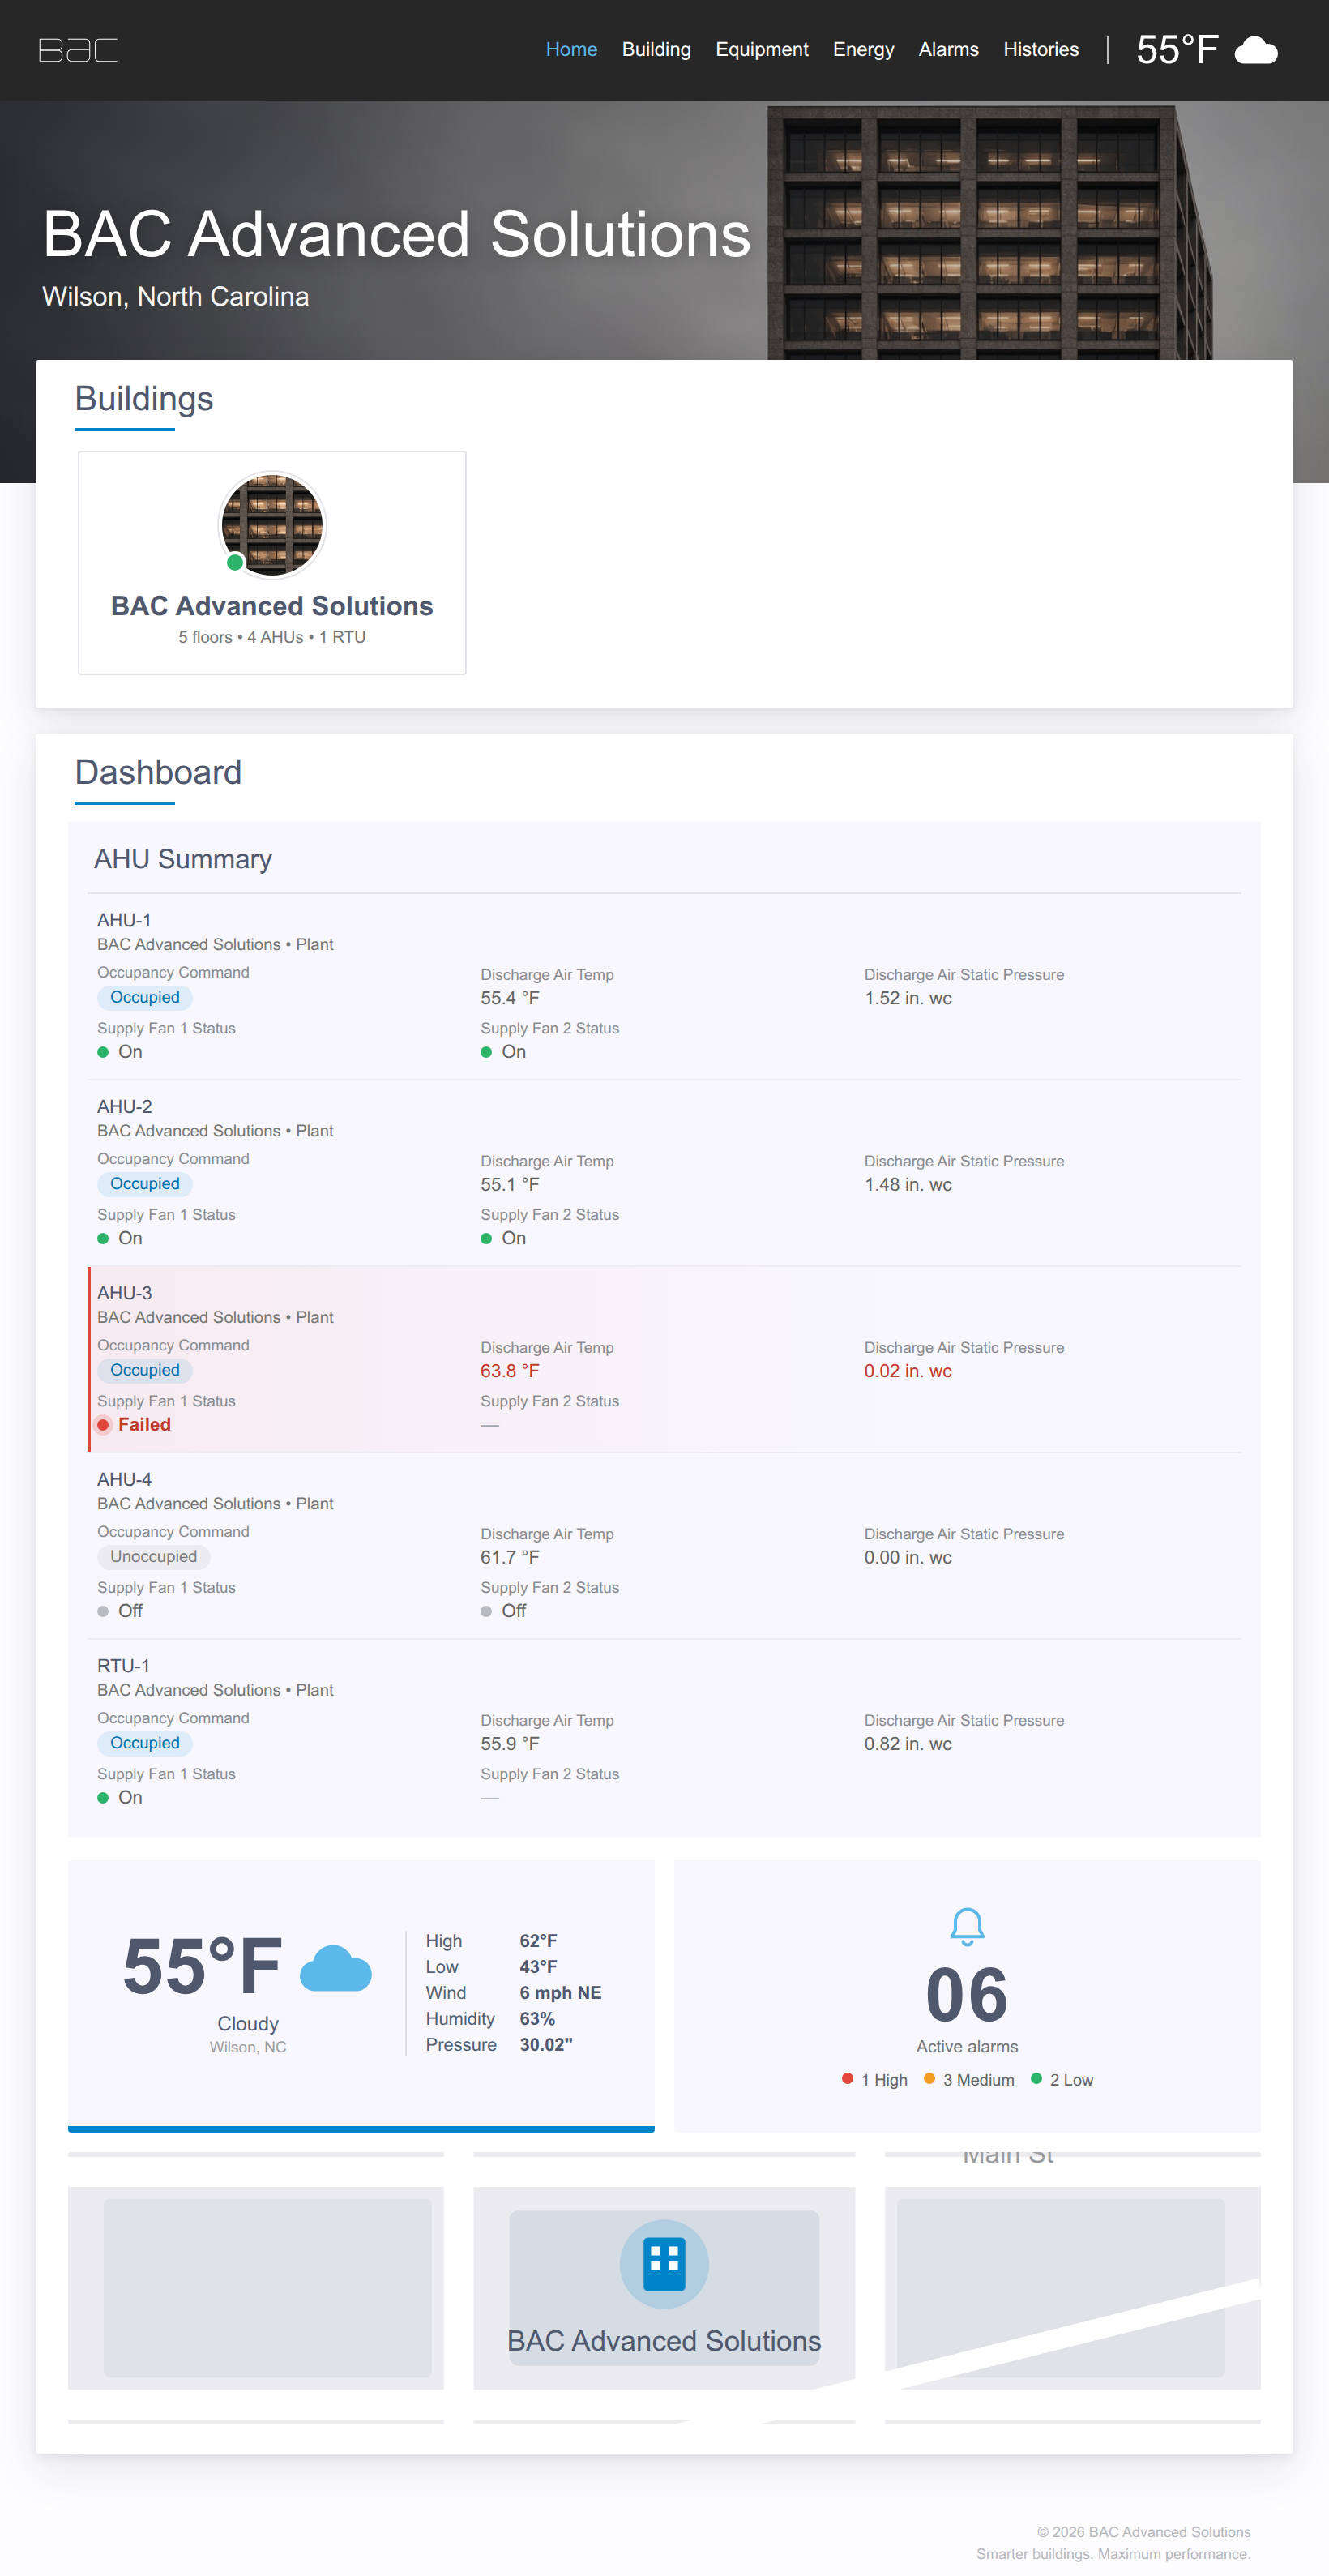
Our graphics rearrange themselves to fit the screen. The same live dashboard works on the control room monitor, a tablet on the mechanical room floor, and the phone in your pocket.
Let our experience help you boost performance, cut costs, and grow your bottom line. Send us a message and we’ll get back to you.